After running the original S&P algorithm for 5+ years we hit on a new idea in early 2025.
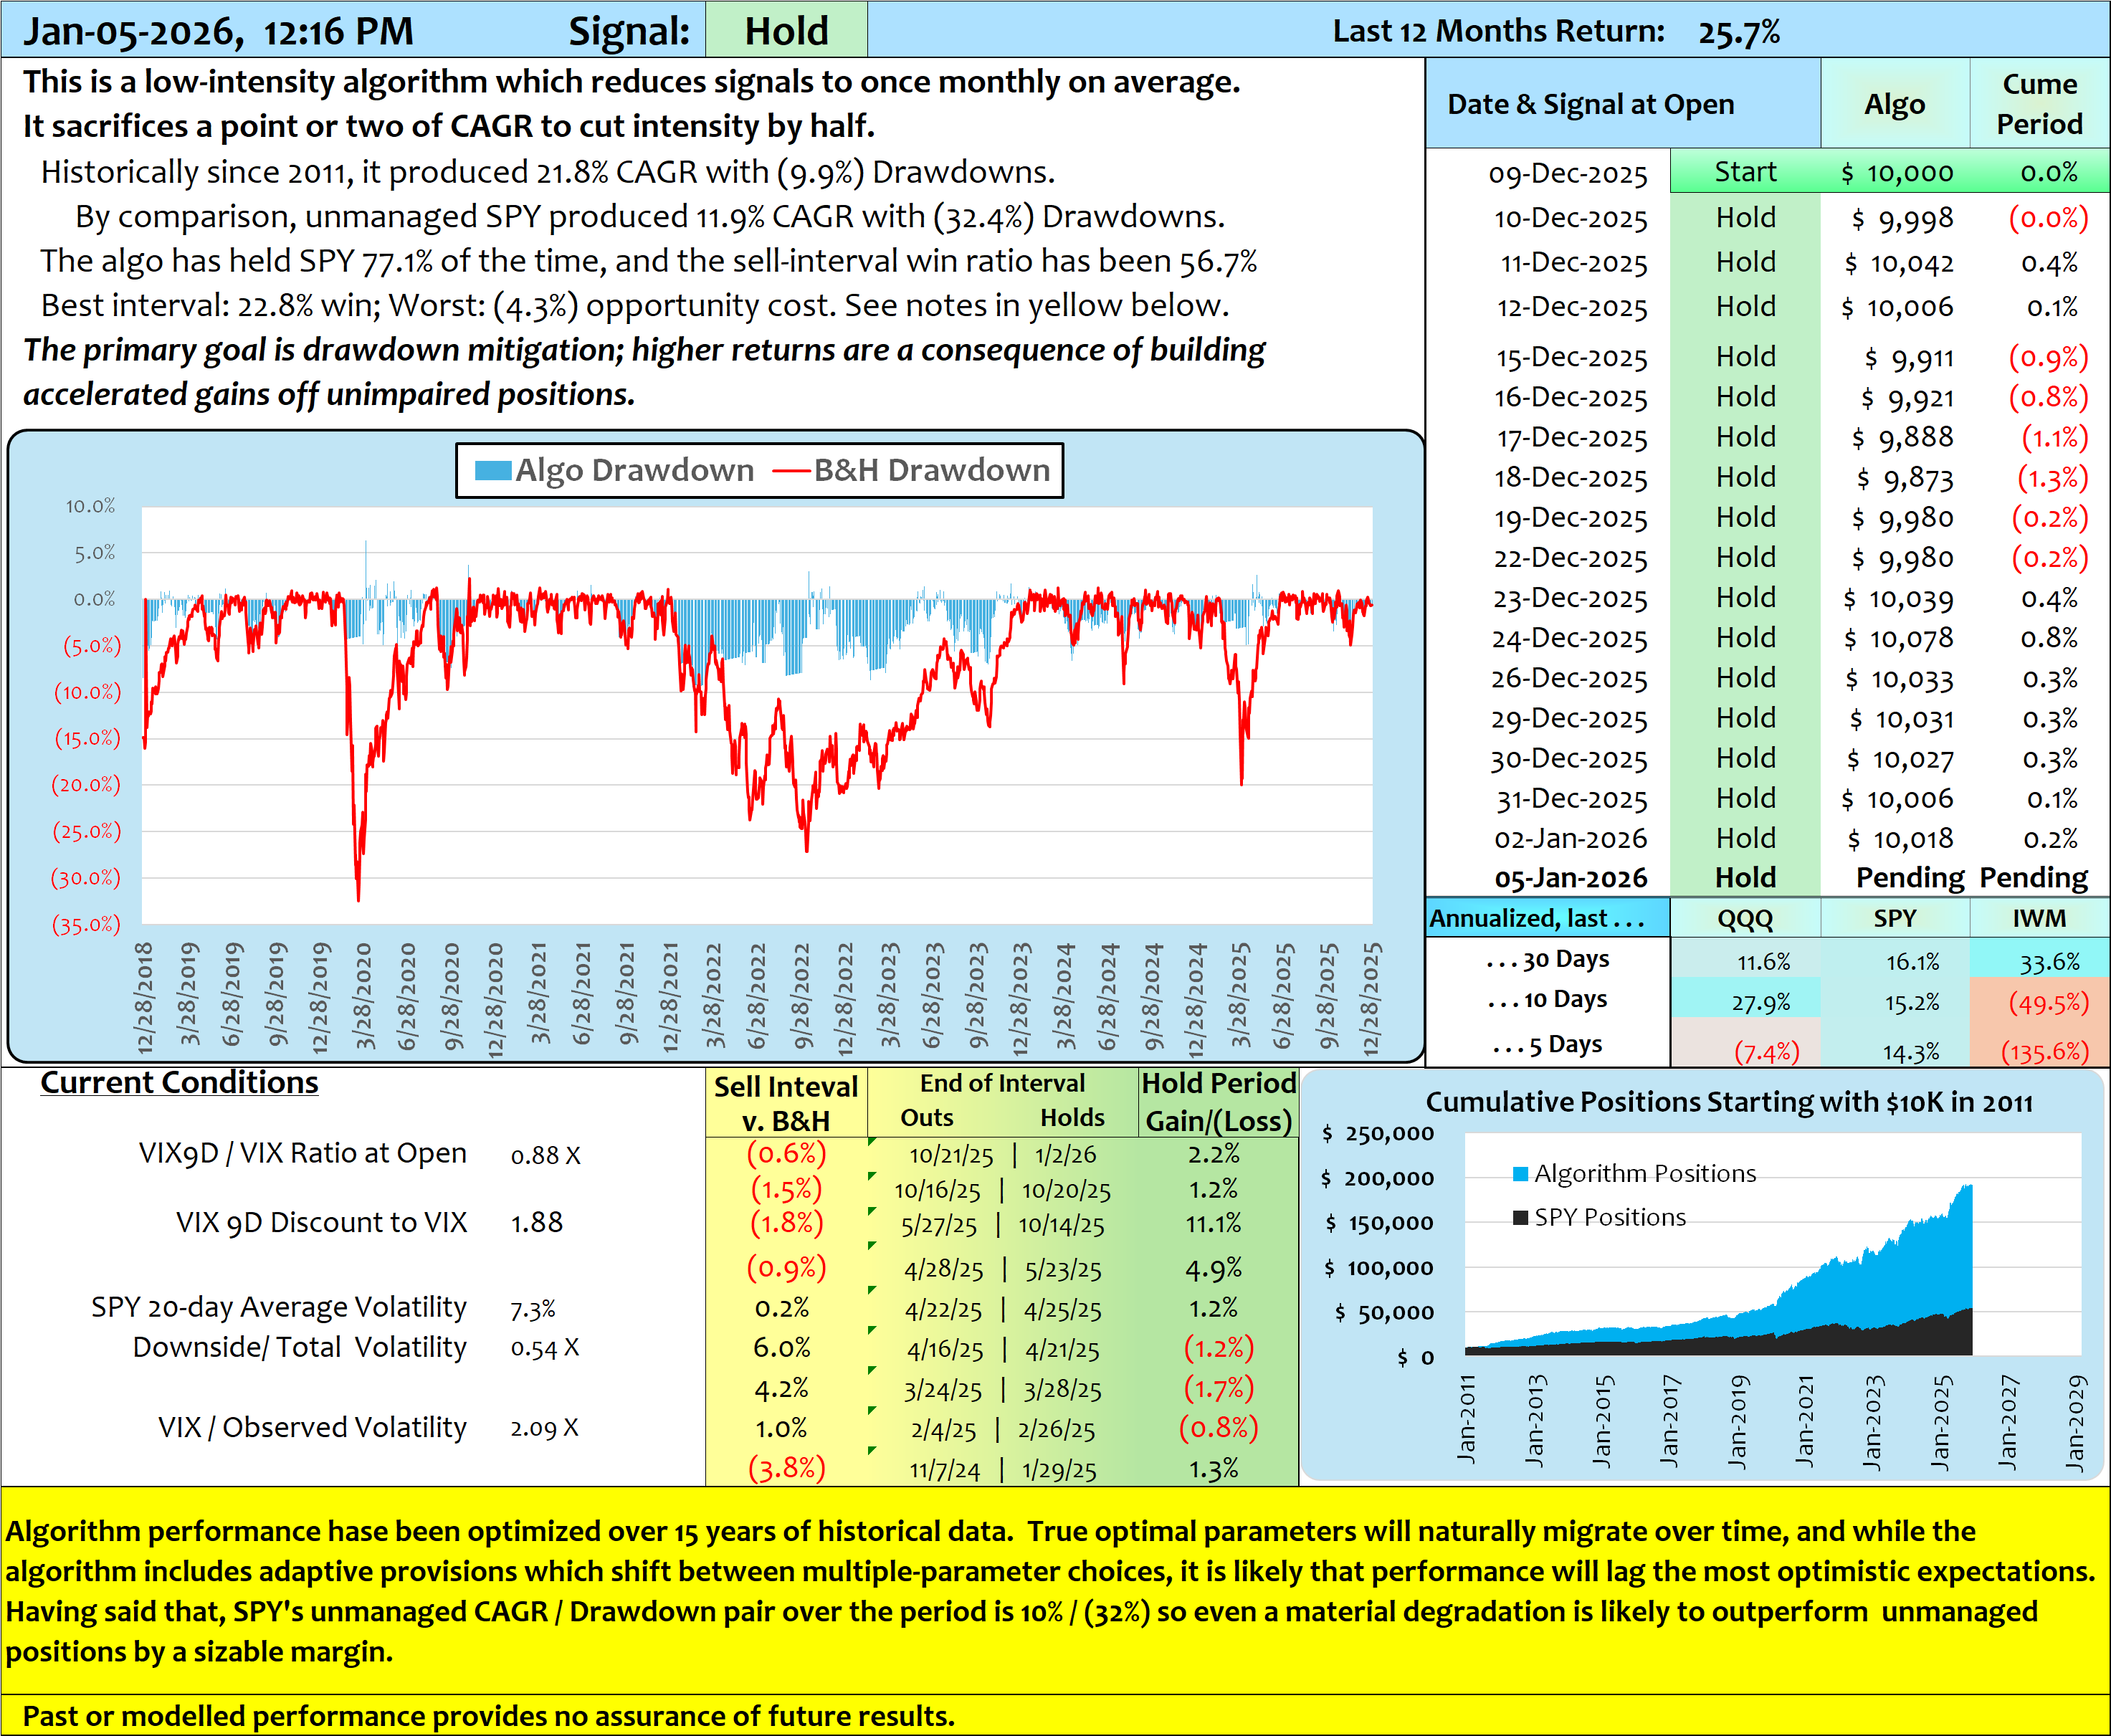
The Risk Signature Algorithm consists of three competing modules where each module produces a risk assessment using a unique methodology. Typical factors include the discount of VIX9D to the VIX, their ratio, the associated next-day gain or loss for the two VIX-related conditions, and SPY trends and observed volatility.
Take a moment to understand why the VIX9D-v.-VIX comparison is indicative of emerging risk. The two indices reflect 9-day and approximately 30-day implied volatilities of S&P options respectively. It’s almost always true that risk is more dramatically manifest in near-term stress whereas longer-term perceptions gravitate toward normalcy. The concept is quantifiable in diversified financial instruments. Market volatility might cause gyrations in near-term gains and losses, but long-term returns gravitate toward normal averages.
So, under normal circumstances VIX9D trades at a discount to VIX; that ‘Difference’ is a discount 70% of the time. But if VIX9D jumps above the VIX level it indicates market sentiment reflects emerging risk. Similarly, the ‘Ratio’ of VIX9D/VIX and the associated historical next-day returns for the Differences and Ratios provide risk information. Calibrating these effects, and a couple of peripheral indicators like observed volatility, is the function of the Risk Signature Algorithm.
Calibrations can be performed using different methodologies; the Risk Signature Algorithm uses three such modules which compete to govern signals. The composite signal is drawn from the module which is performing best over a recent lookback unique to each module, varying from 8 days to 27 days. Signals (buy, sell, hold, out) are produced based on opening values each morning.
The Risk Signature Algorithm produces low-frequency signals, about one per month, an improvement on the number of false signals of legacy models. As modelled, the worst drawdown since 2011 indicated (9.9%) compared to (32%) for unmanaged SPY. By avoiding the worst downturns, the algorithm was able to produce 22% compound annual growth since 2011 and 27% in 2025.
This is excerpted from a 2025 Substack article by Michael Gettings:
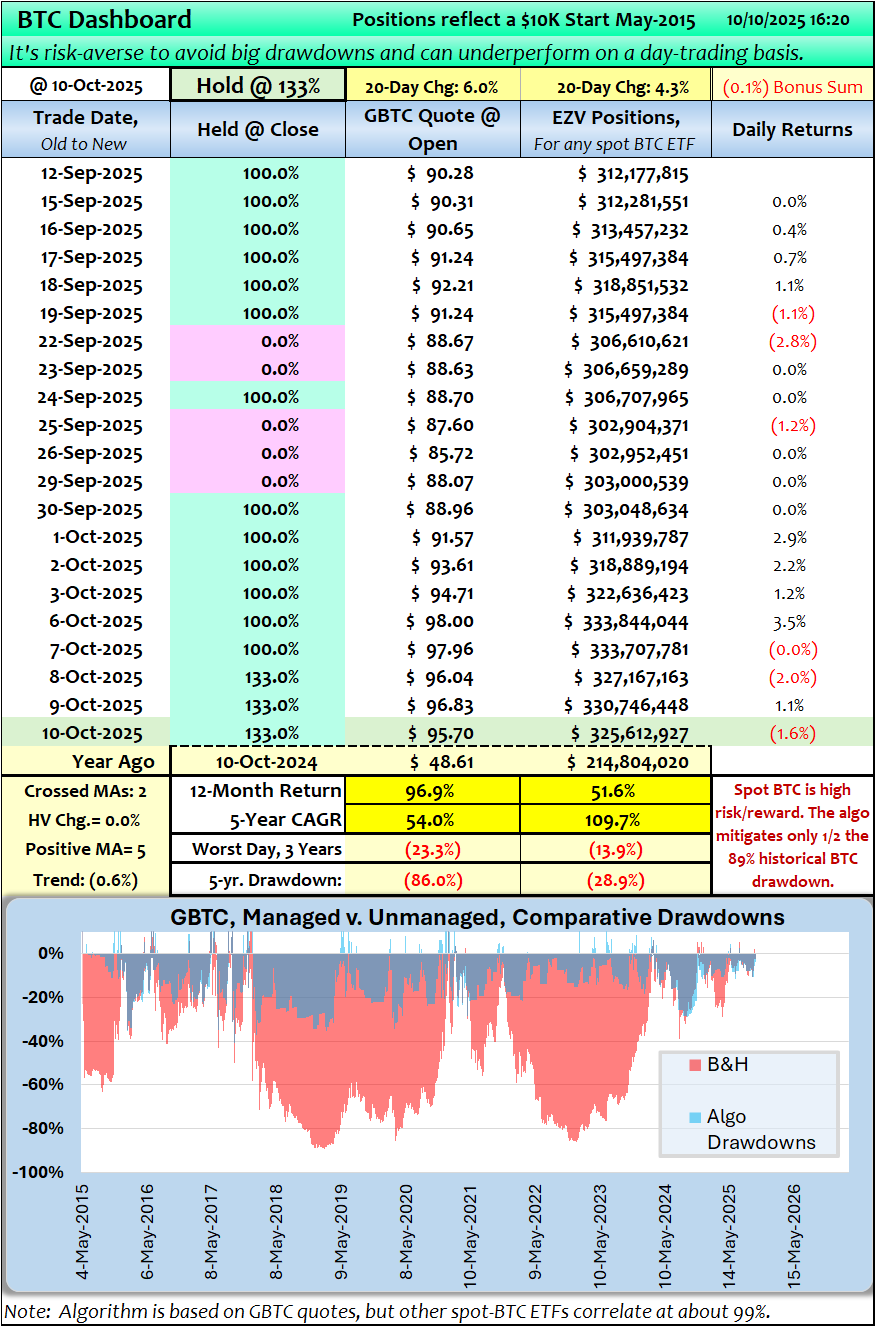
The [BTC] algorithm uses price trends, six moving averages (MAs) as well as incidents of crossing MAs. The shortest moving average is a few days and the longest is well over 100 days. . . . .
An important discovery was that extended loss periods like 2018 and 2022 caused algorithm performance to falter when long-period MAs used fixed lookbacks. The longer MAs lingered in negative territory and delayed signal rebounds, so the long-period lookbacks were reduced for trailing loss periods. That effect was calibrated . . .
When the one-day change in observed volatility exceeds an approximate 18% threshold, the likelihood of a next-day loss increases materially. A one-day 18% volatility change is a big deal, and it occurs about 65 days over the last 10-plus years; that’s a 2.5% incidence. But selling on those days produces aggregate savings of 126%, about 10% annually on average.
Optimized parameters produce 175% annual returns using historical quotes, but I don’t believe that will be replicable in the future. GBTC produced a 69% compound growth rate with no algorithmic enhancement, but that started from $0.42 per share. In 2017 alone, GBTC gained 1,533% from minimal starting valuations.